PRODUCT DESIGN CASE STUDY
ROLE
Product Design
TIMELINE
8 Weeks
PLATFORM
Web App
IMPACT
7% Higher Retest Rate


01 · OVERVIEW
Context
Lab reports show health data as isolated snapshots
No way to connect reports across time
Hard to understand how test values change over time
My role
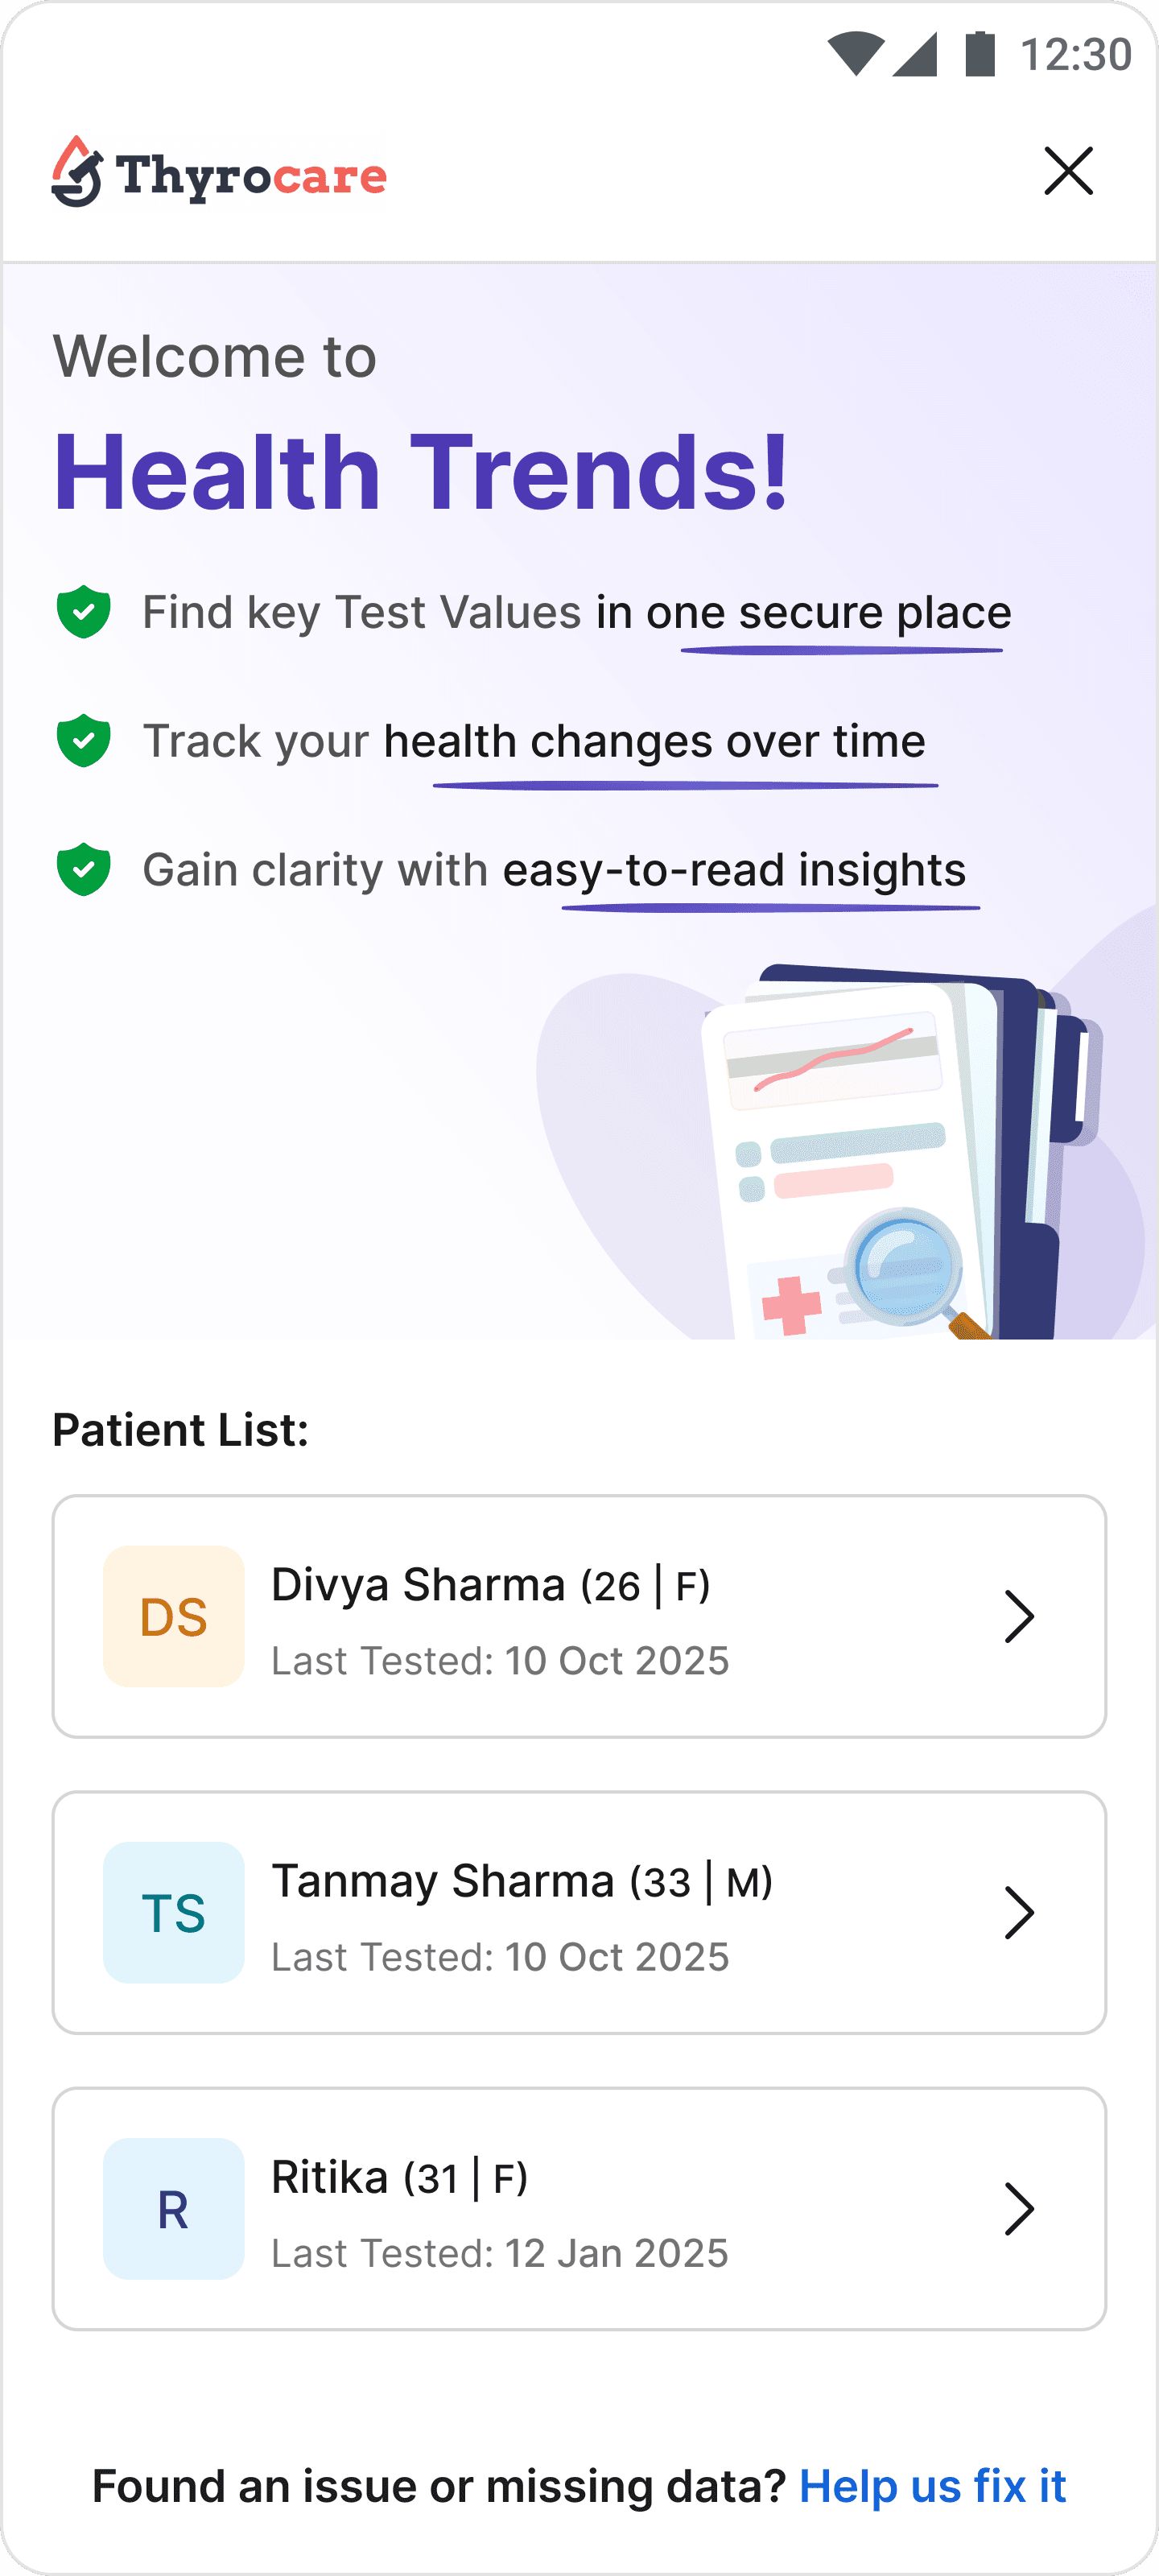
Reviving a previously failed trends feature
Conducting research
Finalise an approach that is easy to use and insightful
Goal
Build a unified health vault to track test values over time
Make pattern spotting simple
Improve user repeat testing
Constraints
Can accommodate trend of only last 5 tests
Maximum bookings come through franchise partners who do not trust us with customer mobile numbers which is the unique identifier for health trends to be possible
02 · THE PROBLEM
Users received lab reports with no context of previous results
. Most Googled, asked around, or ignored outliers
The invested few manually compared old PDFs
Design response
Give users an experience they're familiar with
Borrow the mental models they've built from frequently used fitness and fintech apps where trends feel intuitive, not clinical
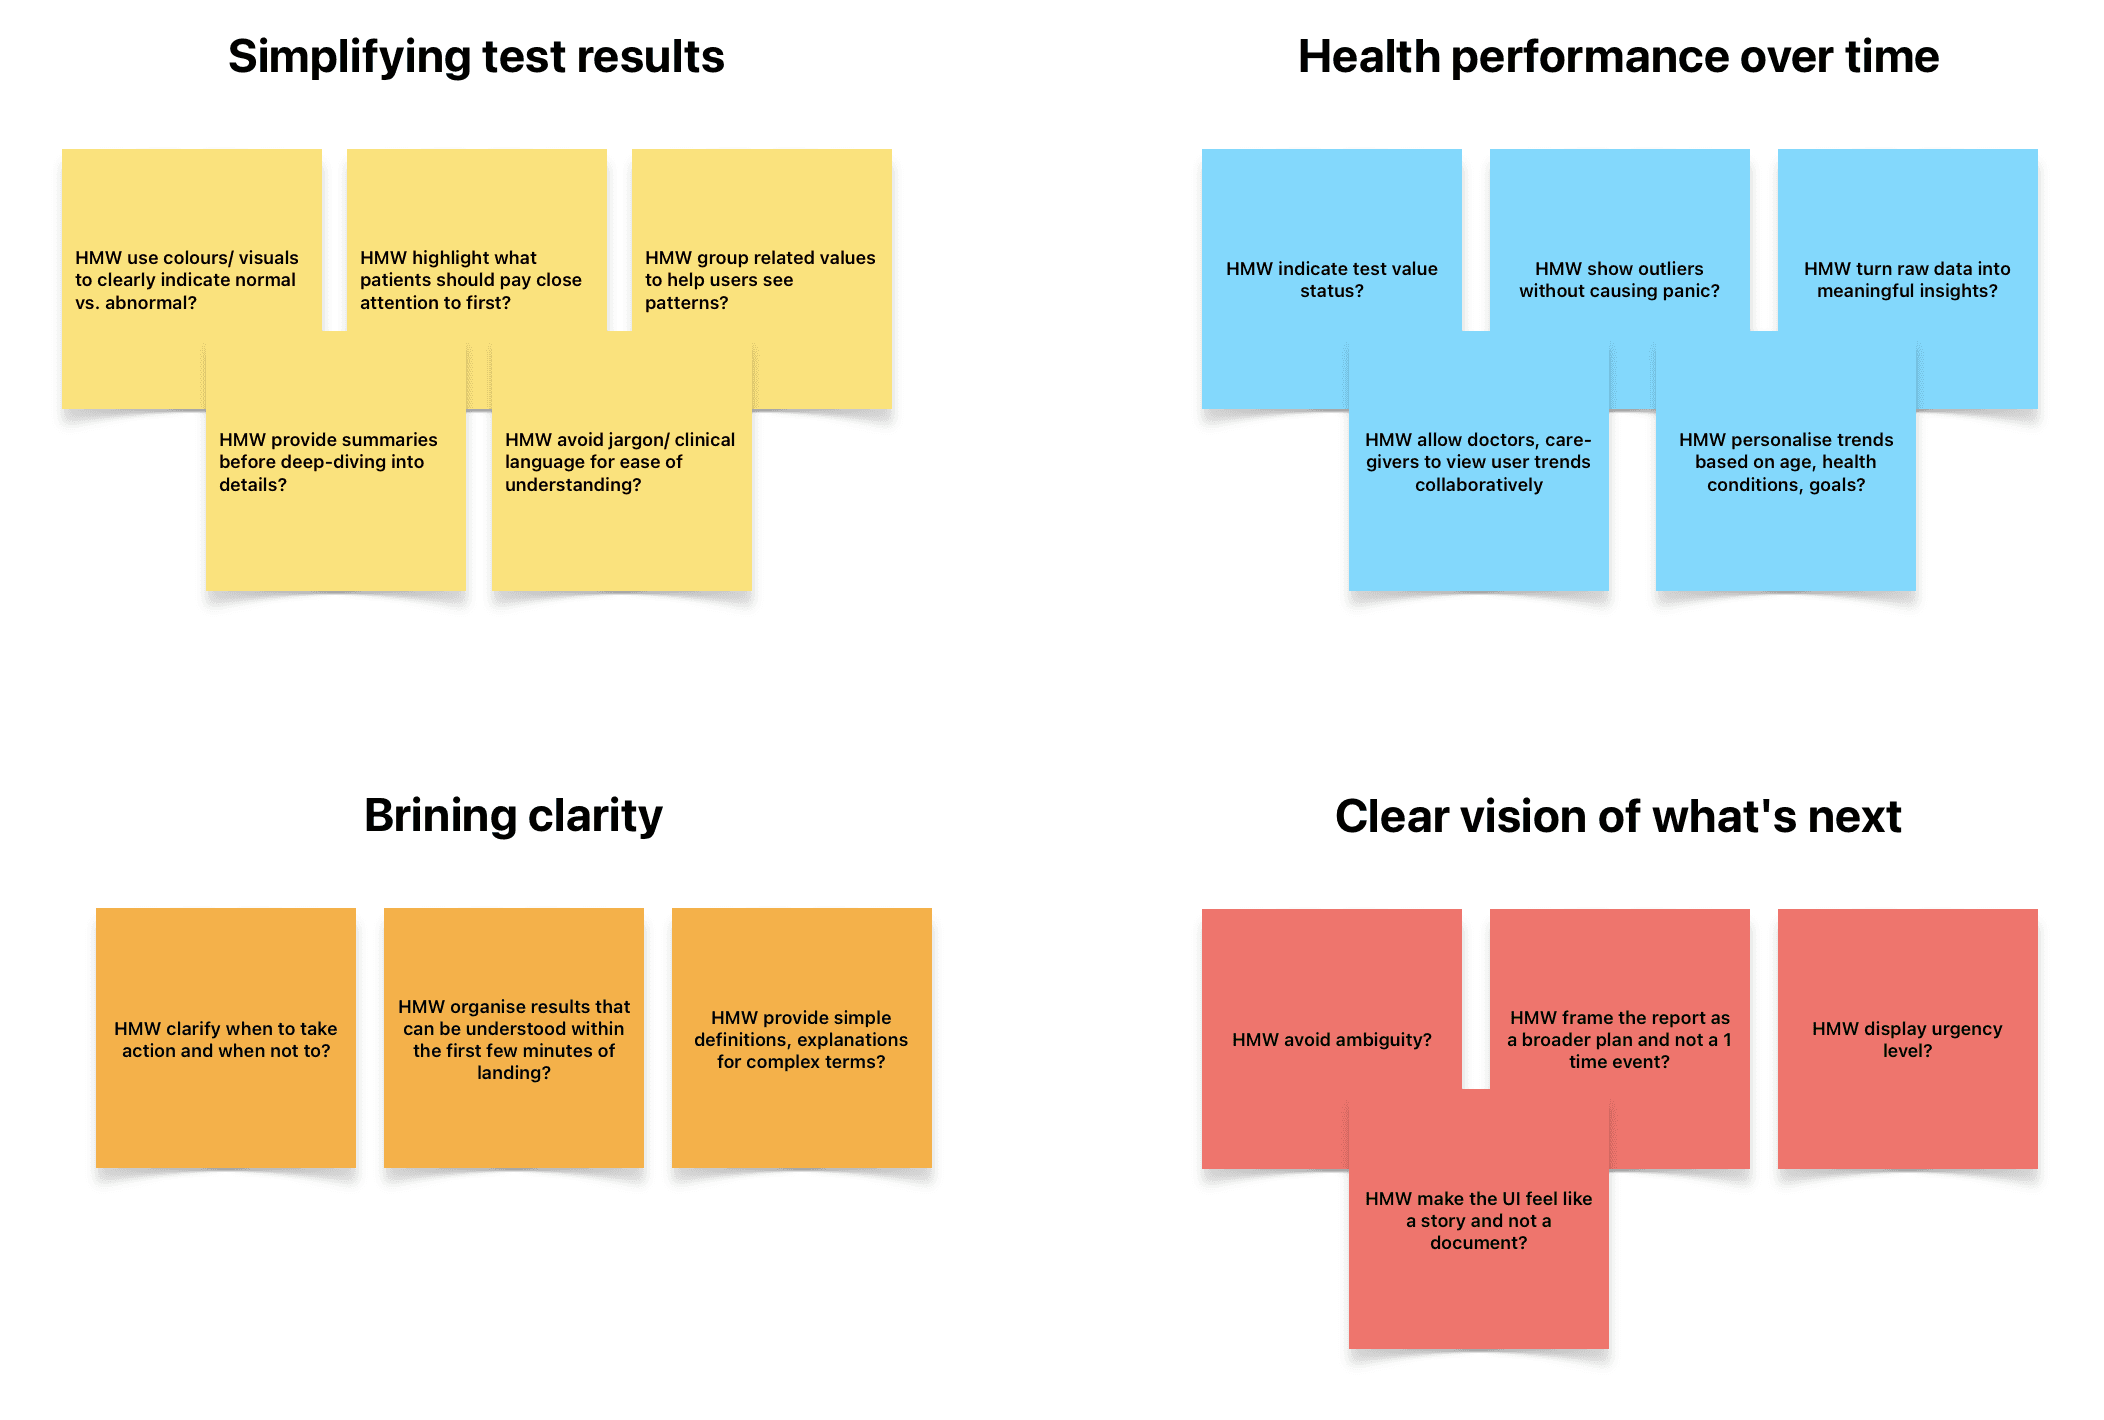
The Design Hypothesis: If they see their results as a trend rather than a number, they'll feel confident enough to act without needing a doctor to decode it
03 · INSIGHTS
1️⃣ Convenience:
How to show data
Bar graphs and trend lines outperform raw tables
~27% of adults can independently read stock/finance-style charts
2️⃣ Assistance:
How to explain data
Analogies help patients grasp complex health info
Empowering patients to understand their own data reduces dependence on doctors to decode it
3️⃣ Recommendations:
What to act on
Show zone-based indicators (red/orange/green) as the default — majority preference
Layer in exact values for users who want them
Prioritise actionable next steps


04 · OUTCOME
7%
higher retest rate
250+
increase in daily D2C orders
₹50k+
increased weekly revenue
05 · LEARNINGS
Make ambiguity visible
Assumptions moved faster when written down and tested — not buried in polished screens.
Design the handoff early
Technical constraints became design inputs when edge cases were defined early.
Metrics need narration
Users don't drop because they don't care, they drop because the journey makes them feel lost.